
Lab 5 Instrumenting Your First LLM with OpenTelemetry
In previous labs, we built the "brains" of the machine. We explored embeddings, set up a vector database, and even constructed a functional RAG pipeline. But there is a lurking problem with LLM development: The Black Box.
You send a prompt, you wait (sometimes an agonising amount of time) and then you get a response. But what is happening inside the LLM?
- How many tokens did that specific step use?
- Why did the latency spike?
- Did the model actually see the system prompt correctly?
In this lab, we'll explore the foundation of AI Observability by instrumenting your first LLM with OpenTelemetry (OTel). This serves as the bedrock for observing AI systems, turning that "invisible" processing time into structured, analysable data.
Why OpenTelemetry?
OpenTelemetry is an open-source observability framework. It’s not a tool itself, but a standard way to collect and export data (traces, metrics, and logs).
The lab!
<a href="https://github.com/steveworley/ailab-105 target="_blank" class="inline-block px-4 py-2 font-bold text-decoration-none text-white bg-blue-600 rounded hover:bg-blue-700 transition-colors flex items-center gap-2"> View the Lab Repository
When we talk about "Observing LLMs," we are usually interested in Traces. A trace tells the story of a request. In a RAG pipeline, a trace would visualize the chain of events:
- User Query
- Embedding Generation
- Vector DB Retrieval
- LLM Synthesis
Today, we start simple. We are going to instrument a basic completion call to see what the "raw" data looks like.
Step 1: The setup
We need to install the OpenTelemetry SDK and the specific instrumentation library for our model provider (we'll use OpenAI for this example, as the OTel conventions for it are mature).
# Clone the repository
git clone git@github.com:steveworley/ailab-105.git
cd ailab-105

# Build the container
docker-compose build
Step 2: The "invisible" script
Here is a standard, un-instrumented script. It runs, it works, but it tells us nothing about its internal performance.
import os
from google import genai

# Create a client using the google-genai SDK
client = genai.Client(api_key=os.environ.get("GEMINI_API_KEY"))

print(f"API KEY: ", os.environ.get("GEMINI_API_KEY"))

response = client.models.generate_content(
    model="gemini-2.0-flash",
    contents="Explain quantum entanglement in one sentence."
)

print(response.text)
Our sample script sets up a model integration with Gemini to start a conversation and generate a response. We can run this to see the example output:
docker compose run --rm python python app.py

API KEY:  {key}

Quantum entanglement is a phenomenon where two or more particles become linked together in such a way that they share the same fate, no matter how far apart they are separated.
Step 3: Illuminating the Box
Now, let's add OpenTelemetry. We aren't going to send this data to a dashboard just yet (that requires infrastructure like Jaeger or Honeycomb). Instead, we will use a ConsoleSpanExporter to print the "invisible" telemetry data directly to your terminal.
# instrumented.py
import os
from google import genai

# 1. Import OpenTelemetry classes
from opentelemetry import trace
from opentelemetry.sdk.trace import TracerProvider
from opentelemetry.sdk.trace.export import BatchSpanProcessor
from opentelemetry.sdk.resources import Resource, SERVICE_NAME
from opentelemetry.exporter.otlp.proto.grpc.trace_exporter import OTLPSpanExporter
from opentelemetry.instrumentation.google_generativeai import GoogleGenerativeAiInstrumentor

# 2. Setup the Tracer Provider with service name
resource = Resource(attributes={
    SERVICE_NAME: "otel-llm"
})
trace.set_tracer_provider(TracerProvider(resource=resource))

# 3. Setup the OTLP Exporter
# Send traces to the Aspire dashboard via gRPC
otlp_exporter = OTLPSpanExporter(
    endpoint=os.environ.get("OTEL_EXPORTER_OTLP_ENDPOINT", "http://aspire:18889"),
    insecure=True
)
trace.get_tracer_provider().add_span_processor(
    BatchSpanProcessor(otlp_exporter)
)

# 4. The Magic Line: Auto-Instrumentation
# This hooks into the Gemini library and automatically captures calls.
GoogleGenerativeAiInstrumentor().instrument()

# --- Your Standard Application Code Below ---

# Create a client using the google-genai SDK (required for instrumentation)
client = genai.Client(api_key=os.environ.get("GEMINI_API_KEY"))

print("🤖 Asking the model...")
response = client.models.generate_content(
    model="gemini-2.0-flash",
    contents="Explain quantum entanglement in one sentence."
)

print(f"\n💬 Answer: {response.text}")
This uses the autoinstrumentation feature of OpenTelemetry to automatically capture calls to the Gemini library.
$ docker network create aspire-network

$ docker run -d --name aspire \
  --network aspire-network \
  -p 18888:18888 \
  -p 18889:18889 \
  -p 18890:18890 \
  mcr.microsoft.com/dotnet/aspire-dashboard:latest

$ docker compose run --rm python python instrumented.py

🤖 Asking the model...

💬 Answer: Quantum entanglement is a phenomenon where two or more particles become linked in such a way that they share the same fate, no matter how far apart they are, instantaneously affecting each other's properties.
Step 4: Analysing the data
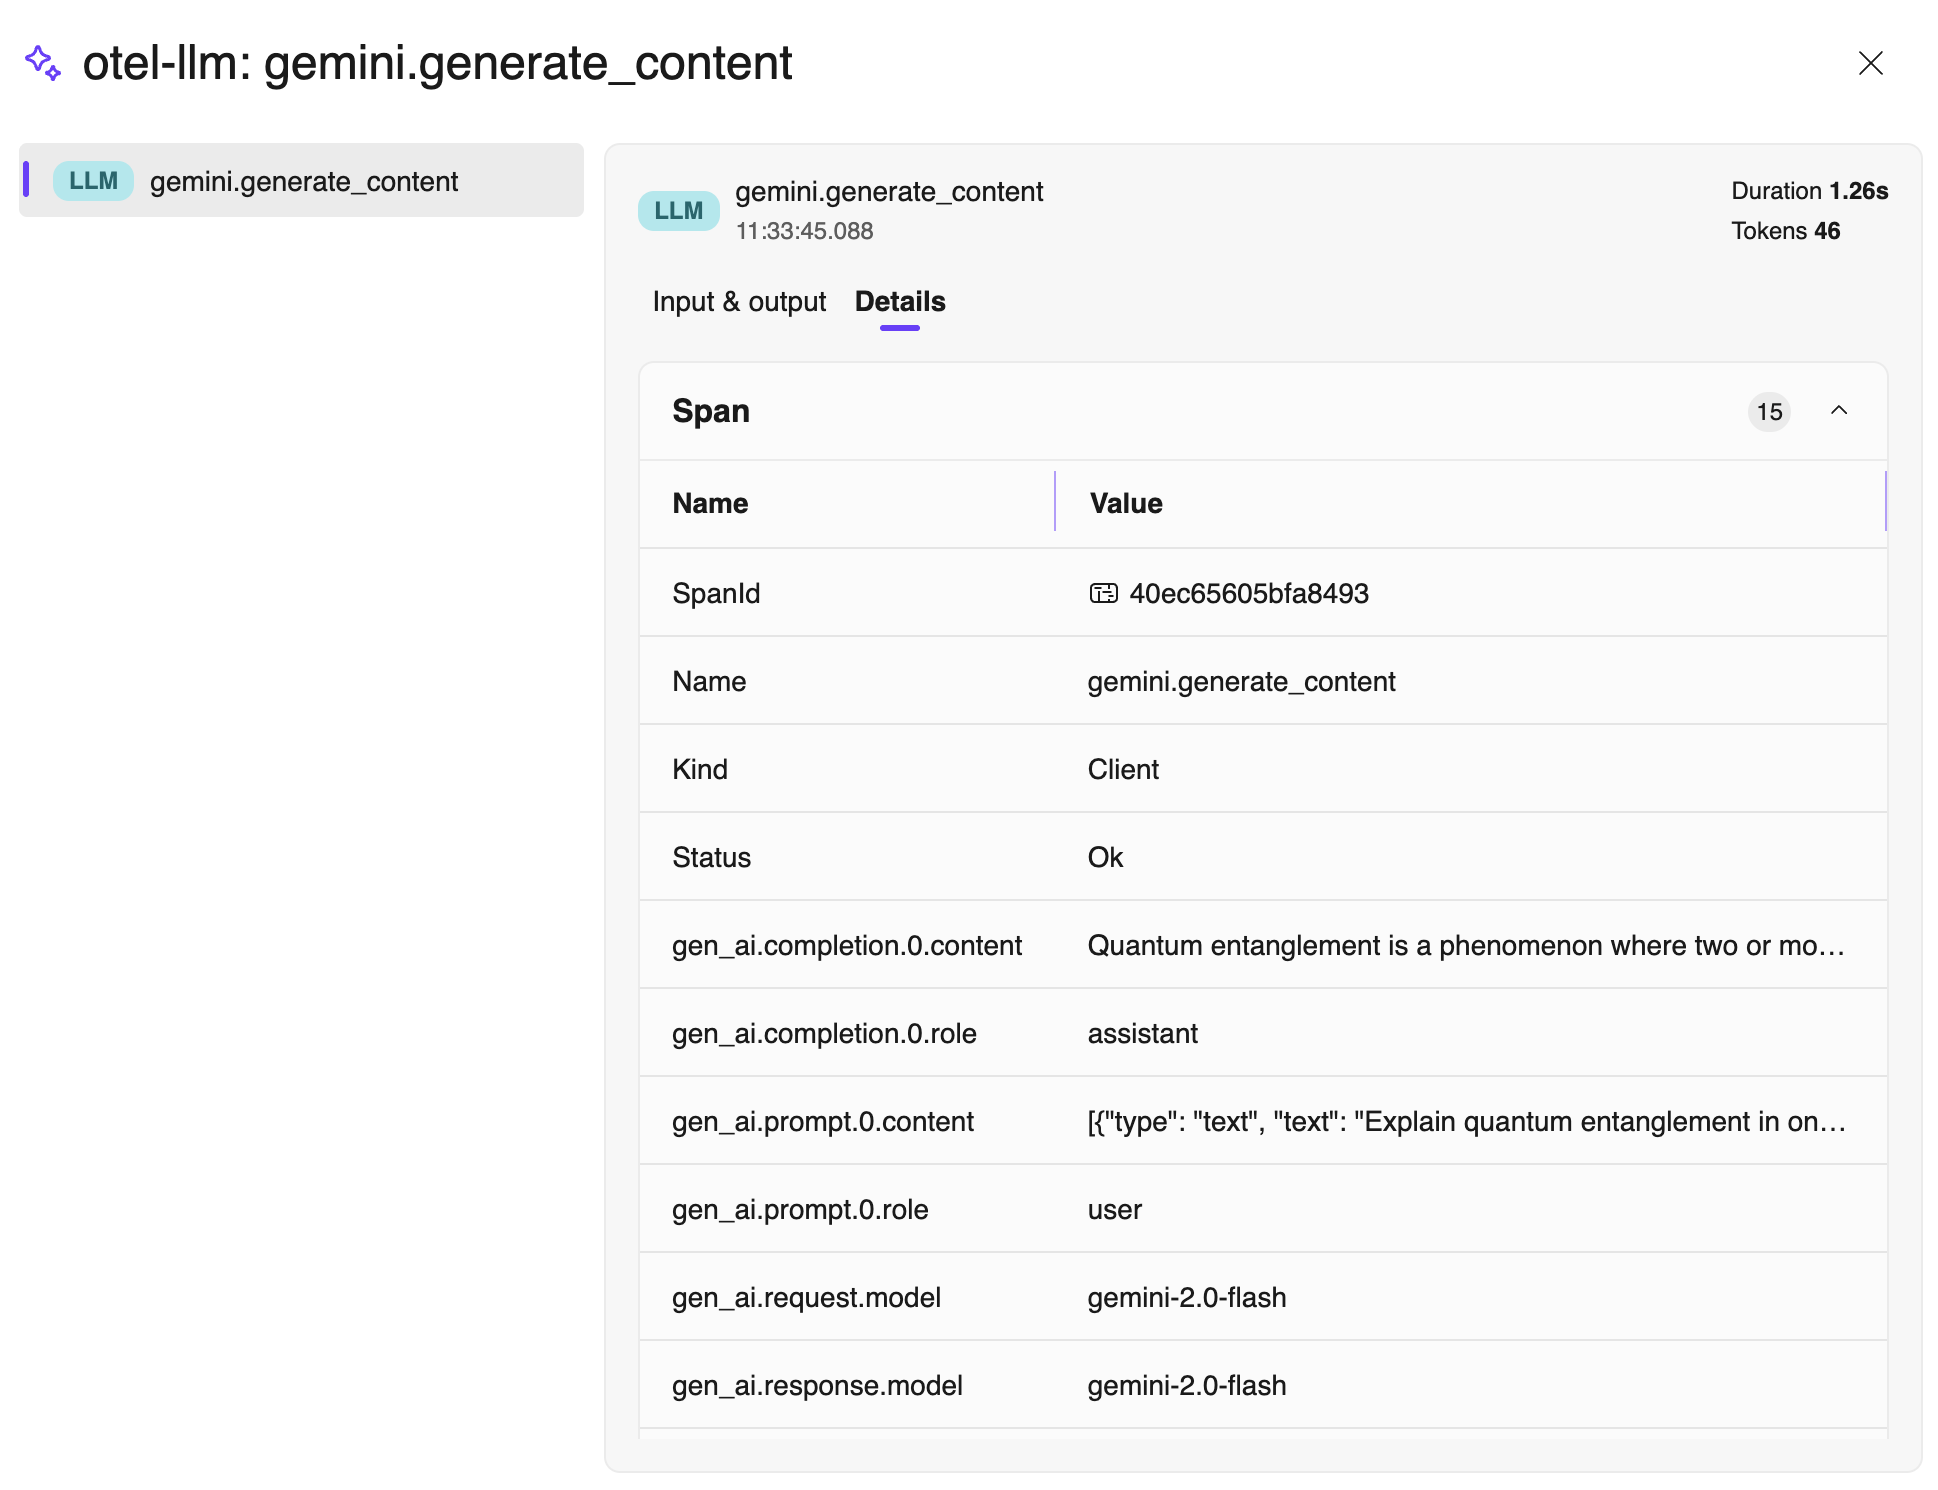
With Aspire running, you can look into the Aspire dashboard to see the results of the trace. This is the invisible becoming visible.
Look closely at the output (the Span). You will see key attributes that you didn't have to code manually:
- gen_ai.system: The provider used (e.g., openai).
- gen_ai.request.model: The model you actually requested.
- llm.usage.total_tokens: The exact cost of the query.
- duration: How long the LLM took to process (latency).
Conclusion
By adding just a few lines of code, we have moved from "hoping it works" to having concrete data on every interaction.